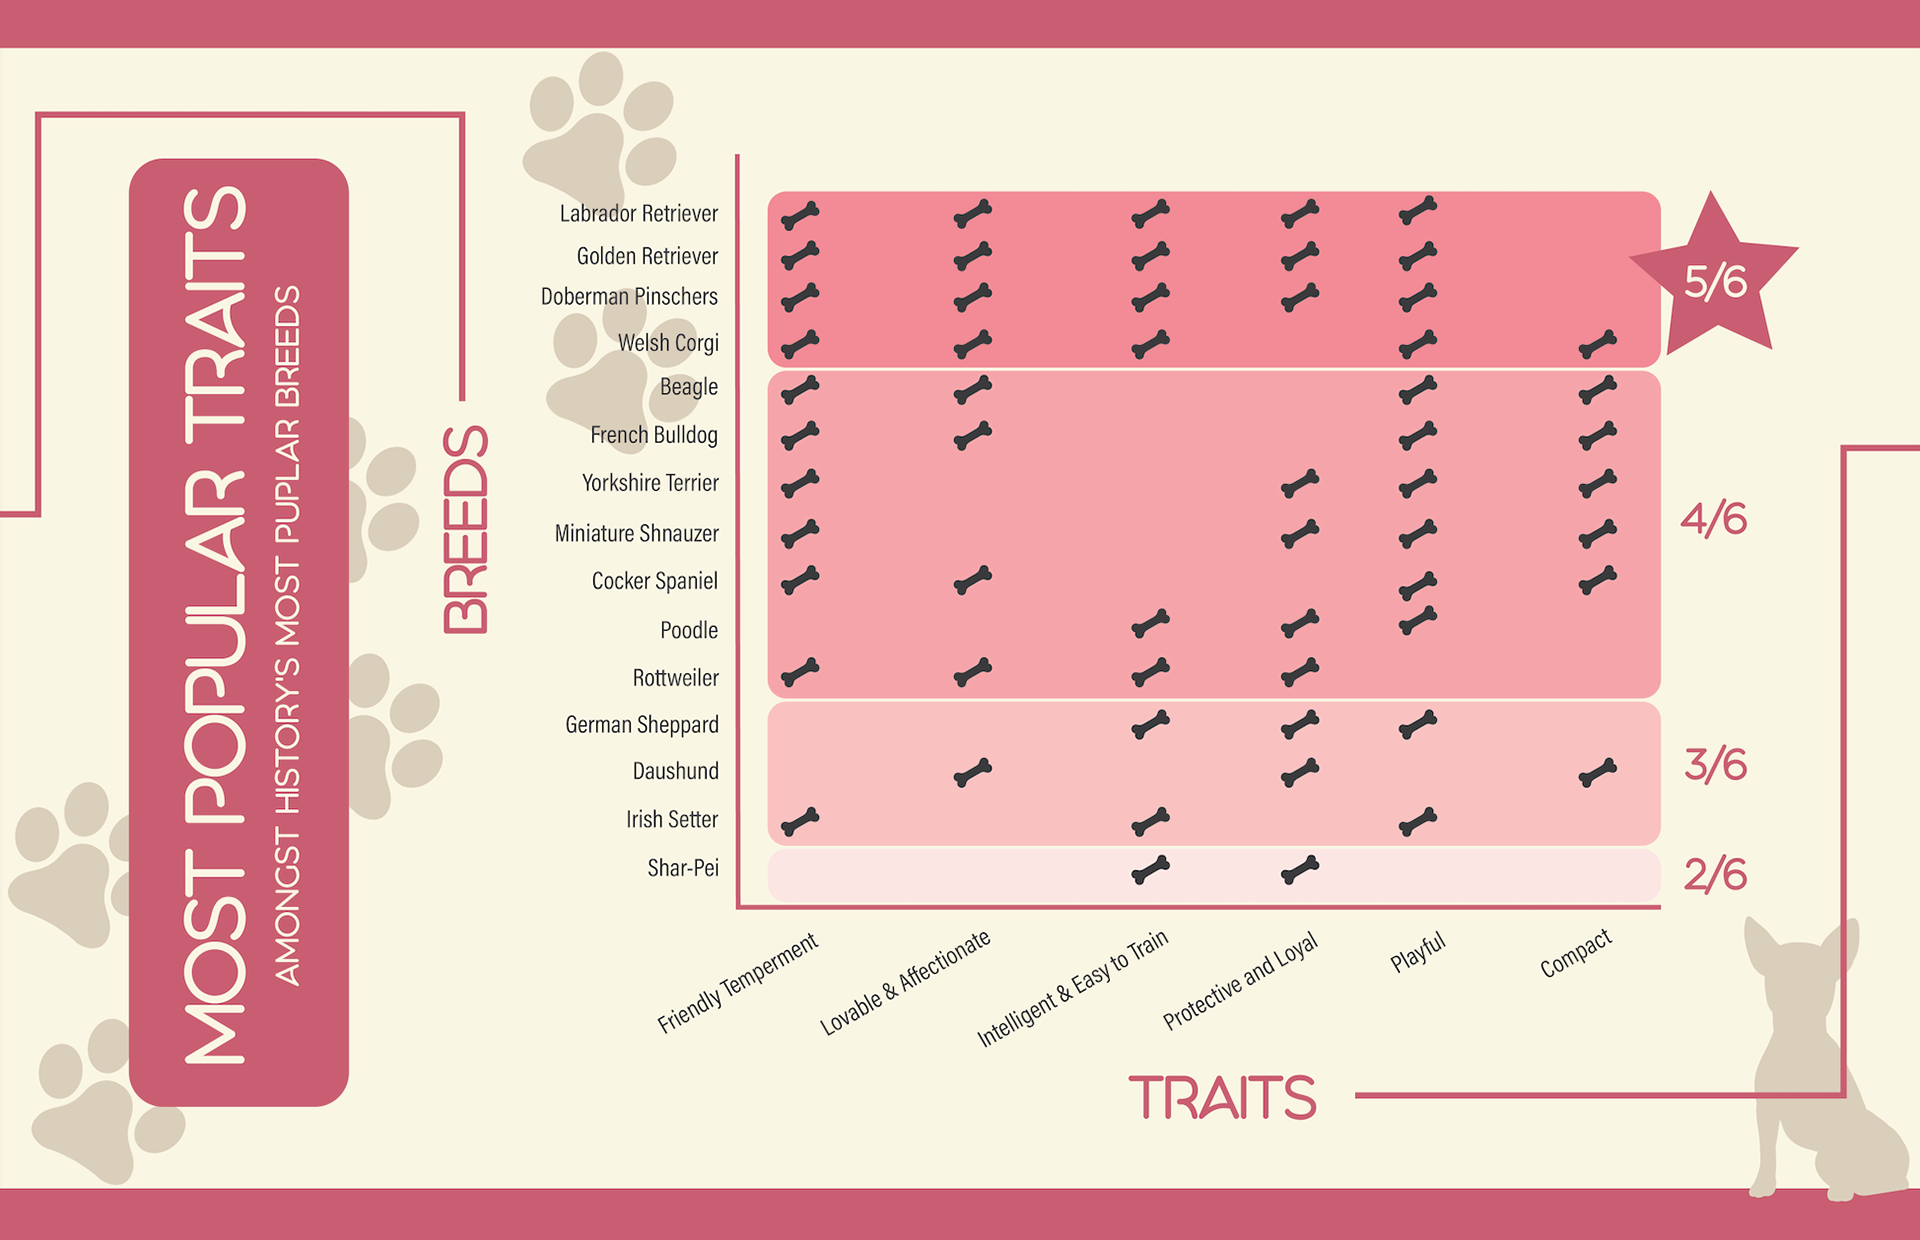
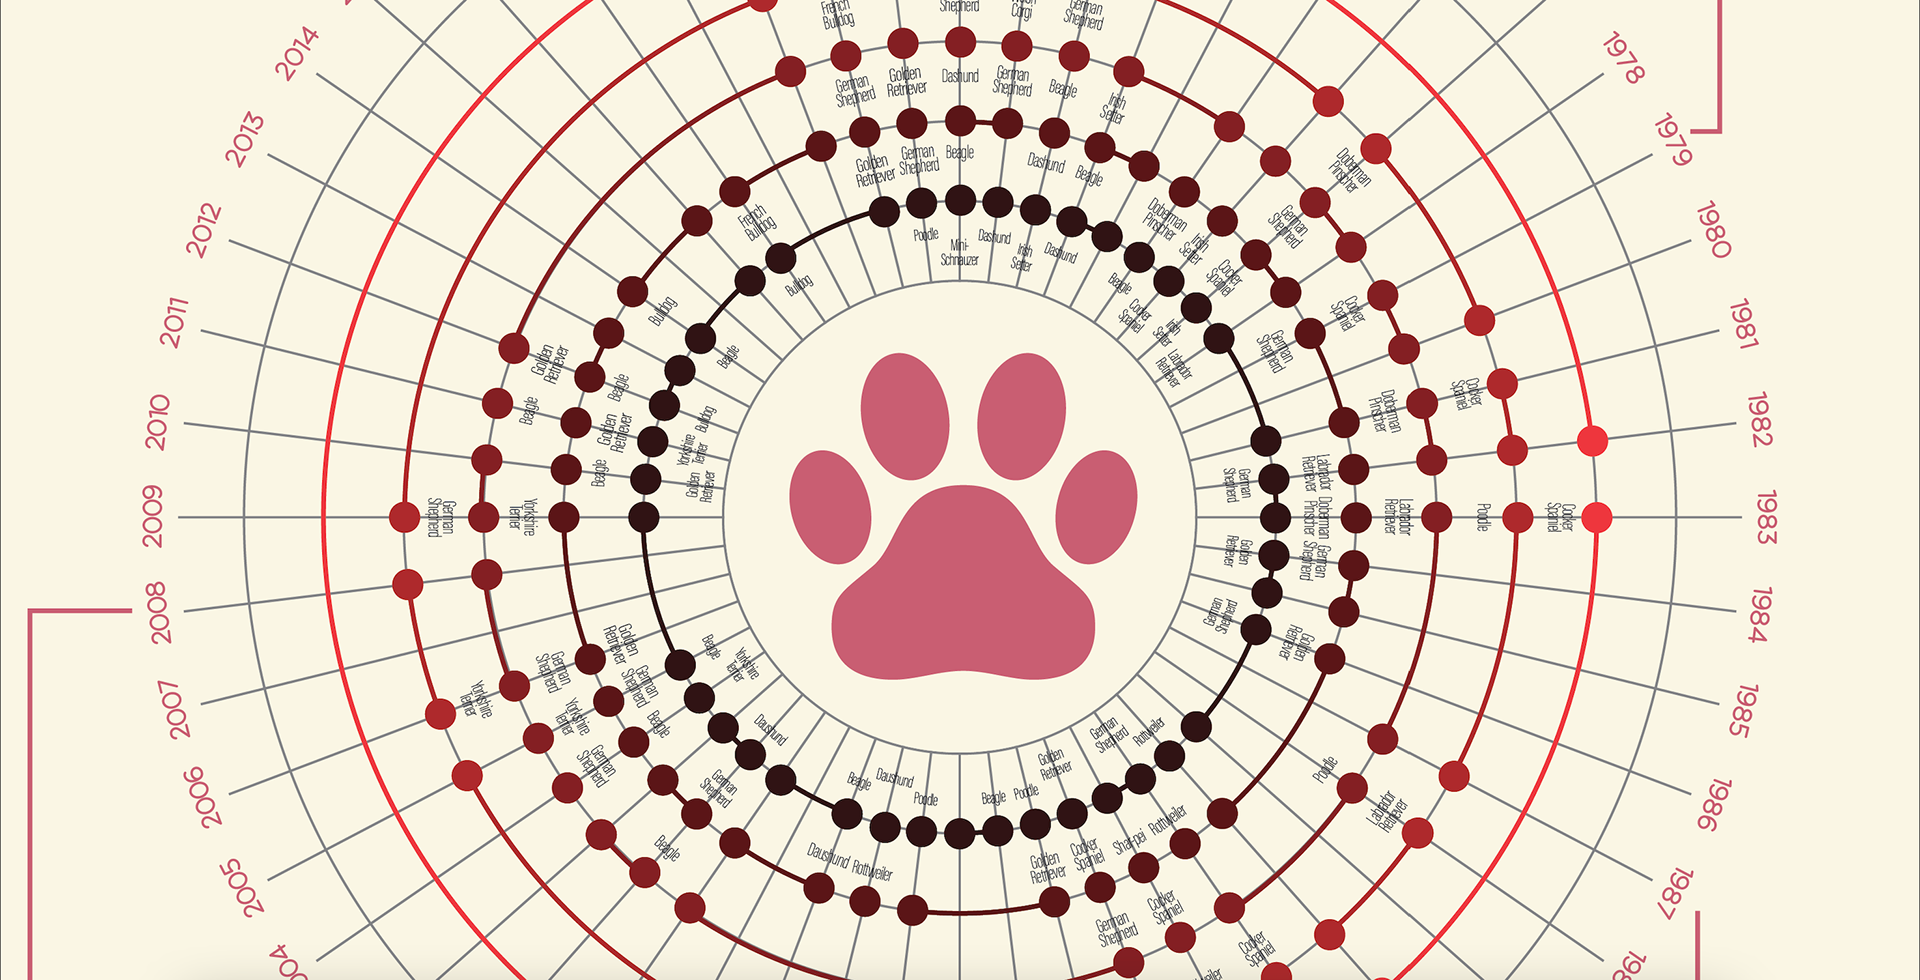
I researched the most popular dogs of the last 50 years and created two data visualizations to show the findings. Once I gathered an adequate amount of information I had to creatively think of a way to develop a clear visual to display my findings to a viewer. I came up with two data visualization charts. One chart focuses on the dogs and the media they appeared in, and the other shows the traits people love about them. I used calm colors like beige and pastel pink to convey the happiness and peace dogs bring to their human companions.
Data visualization 1

Data visualization 2